There are three methods agents use to value a property:
- Analyzing comparable solds (most common)
- The cost approach (what would it take to build the property from scratch)
- The income approach (useful for buy-and-hold properties, especially multi-family homes)
Investors of course use the income approach. As I discussed previously, there are two methods of valuing a property within the Income Approach: Gross Rent Multiplier (GRM) and Capitalization (Cap) Rate. GRM is mostly dependent on what local comparable investment properties are sold for. LOWER is better. Cap Rate can reference the local market, or simply what Cap Rate you are targeting in your business (generally 8% – 12% is considered good). HIGHER is better.
GRM – Lower is Better
Cap Rate – Higher is Better
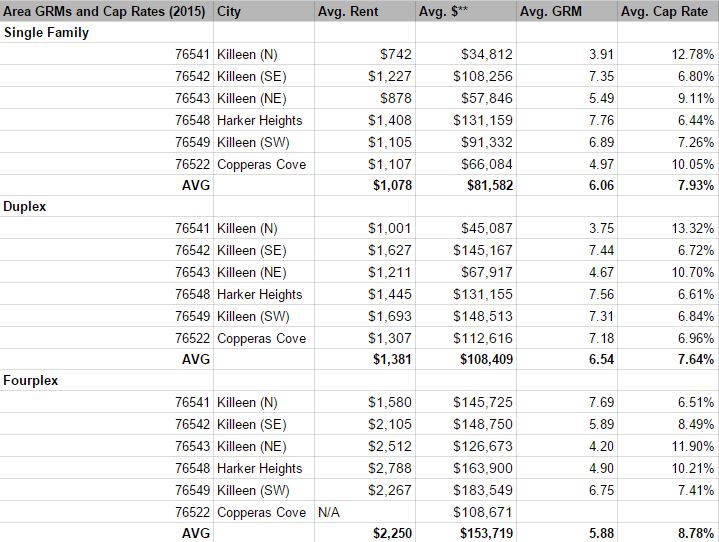
So what are some GRMs and Cap Rates for the Fort Hood Area?
I built the following table based on data from the MLS. Admittedly it must be taken with a grain of salt (a lot of investor deals are not done on the MLS). But it still gives an idea of what some people are achieving on MLS deals, which are likely not even quite as good as off-market deals available in the area.
2015
- *Assumes 50% of gross rents are expenses (vacancy, maintenance, capital expenditures, management, taxes and insurance)
- **Includes only single family foreclosures to estimate “wholesale” prices of single family homes
Analysis
I would not recommend that an investor look at this list and go chase homes in the ZIP codes with the highest Cap Rates. Predictably, the higher GRM and cap rates are generally in areas with lower home values. Although they appear more attractive on paper, it may be the case that those areas suffer from higher tenant turnover or other expenses that exceed our 50% assumption. I don’t think this analysis is useful in guiding investor prospecting habits.
What is is useful for is getting a quick sense of rents and home values in different areas (again, for SFHs they are just foreclosures), and to perhaps compare it to a home you are interested in. If you GRM is higher than the area, is there something about your property that justifies it?
Methodological Shortcomings:
1. By comparing average prices and average rents, we are NOT comparing the same homes that sold and rented. Therefore, it is possible the homes that sold in that year were cheaper, while those that rented were those that rented for more, for example.
2. The sample size is relatively small, depending on the ZIP Code, and may not be statistically significant in some cases.
3. Relatively few Property Managers put rentals into the FHAAR MLS (I would estimate 10%). Therefore the sample size is smaller for rents, and likely skews toward higher end rentals for any given market.
As always, I want to be upfront about a few methodological shortcomings to keep in mind. There is nowhere that off market sales and rents are captured, so using the MLS to approximate what that market may look like is the best we can do. Judging the results empirically, most of the information seems to be a close approximation to what I would expect.
I hope this is helpful. If you are an investor looking for other market data or information to peruse, let me know! I strive to work with investors big and small, and be a resource and tool for their Fort Hood area investing.

