Updated 3/16/18; Originally published 10/12/15
Takeaways
- Don’t count on appreciation when buying a home
- But real estate is an inflation-resistant asset
- The Fort Hood area is keeping up with the national market, which is beating inflation soundly
As home buyers, sometimes it’s tempting to assume the value of real estate is always going to go up.
But that is not always the case. There are ghost towns throughout America, and once major cities like Detroit that are still hollow shells of their former glory.
In fact, history shows that you are probably making a mistake if you are buying for appreciation. Robert Shiller showed a study that over the long term – since 1900 – home appreciation is only about 0.1% better than inflation.
Appreciation was hyped during the housing boom, and it is easy to get a little jealous of our neighbors in places like Austin who are seeing double-digit appreciation. But it’s not reality for everywhere, and not indefinitely.
Inflation
Instead of appreciation, though, we generally can count on at least keeping up with inflation. That is more than the money stuck in your bank account can do.
But even then, not always. I own a house in Lawton, OK for nearly 9 years now that has actually dropped in value from when I bought it. So how is the Fort Hood market doing? Are we at least keeping up with inflation?
The answer is yes! And then some.
When I first wrote this article in 2015, the Fort Hood market appreciation from 2009 at 2.2% annualized exactly matched the rate of inflation. Since then, inflation has gone down, and prices have continued to go up.
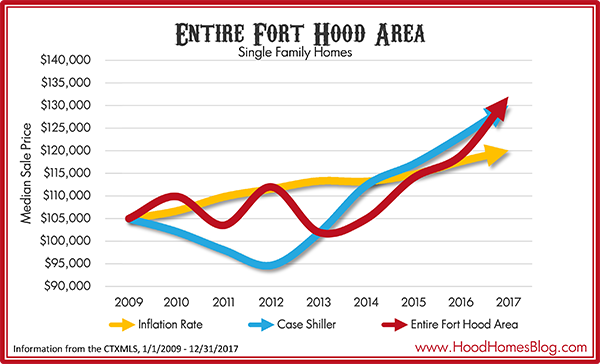
From the graph, we see that the Fort Hood area weathered the Great Recession better than most areas in the country, but also did not benefit as much from the subsequent housing recovery.
That said, 2016 and 2017 prices were strong, and the area is right on track with strong national housing market, and is beating inflation!
Real vs. Nominal Appreciation
As I wrote elsewhere, the median Fort Hood price in the area was up 11% in 2017. That is phenomenal! But that is the nominal value, not the real value. The real value measures your purchasing power of that value, i.e. takes into account inflation. At an estimated 2% in 2017, that means that the “real” appreciation in Fort Hood housing prices was actually about 9% (11% – 2%).
| Year | Fort Hood Area Median Price | Inflation Rate | Case Shiller Index |
|---|---|---|---|
| 2009 | $105,000 | 2.63% | 151.53 |
| 2010 | $109,900 | 1.63% | 147.41 |
| 2011 | $103,500 | 2.93% | 141.55 |
| 2012 | $112,000 | 1.59% | 136.64 |
| 2013 | $102,000 | 1.58% | 146.92 |
| 2014 | $104,900 | -0.09% | 162.13 |
| 2015 | $114,000 | 1.37% | 168.97 |
| 2016 | $118,950 | 2.50% | 177.83 |
| 2017 | $132,000 | 2.07% | 187.64 |
Fort Hood is Crushing it Right Now!
In fact, The Fort Hood area since 2009 has been whooping on inflation, and even slightly outpacing the national market as well!
Below are the Average Compound Annual Growth Rates for all three metrics since 2009.
| Fort Hood | Inflation | Case-Shiller Index |
|---|---|---|
| 2.90% | 1.69% | 2.71% |
The Fort Hood numbers are not counting new build construction during those years, as those values and numbers are not reliably reported to the CTXMLS.
So what?
Buying property is great because it is generally an inflation-resistant asset. That is just one more reason to consider buying instead of renting. Rent money doesn’t keep up with inflation. It just disappears.
For homeowners in the Fort Hood market, it’s great that we are managing at least that much! Rising prices also make it easier to sell in a buyer-friendly market like ours. Hopefully years like 2017 continue, but more often than not they even out. Hope for the best! But don’t count on better than inflation.
By City
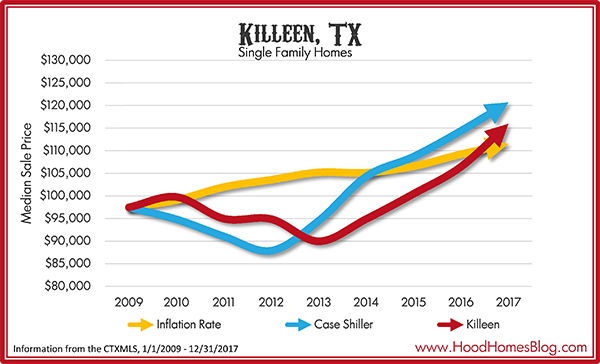
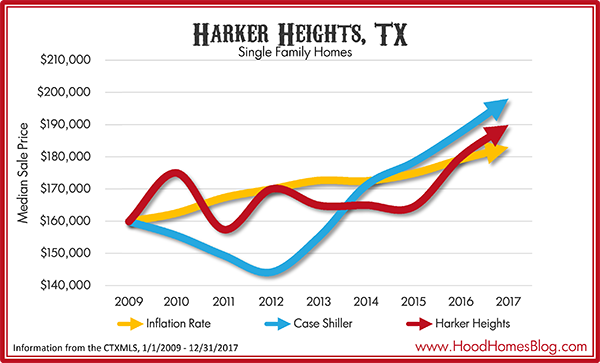
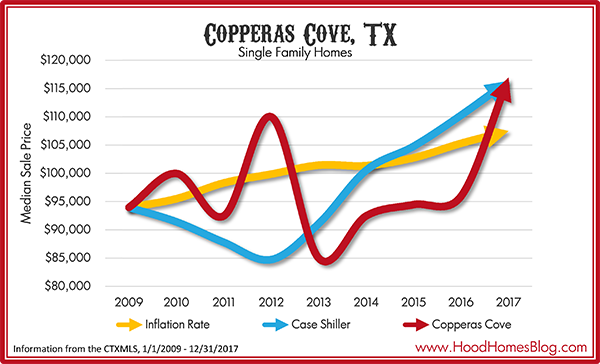
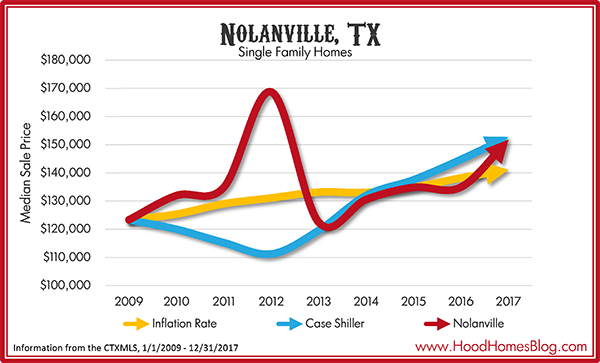
In case you would like to map out the individual cities in our area, here is how they stack up!
Note that the baseline is 2009, so we are only looking at how the markets have done in each city per expected inflation/growth from 2009.
Interestingly, no single city’s average growth amounts to the area’s numbers as a whole. This could be explained by an increasing number of sales in the higher price point market (like Nolanville and Harker Heights) which is pushing the median area value up faster than any single city’s median value is rising.
Conclusion
Smart investors don’t buy for appreciation but cash flow.
Smart homeowners don’t buy for appreciation but for the other multitudinous advantages of homeownership.

